Visualising Urban Growth in Australian Cities 2015 – 2024
As part of a recent Industry Event series hosted in Macqaurie Bank/Cloudstaff we wanted to gain an understanding of how the built landscape of Australian Cities has transformed over the last decade.
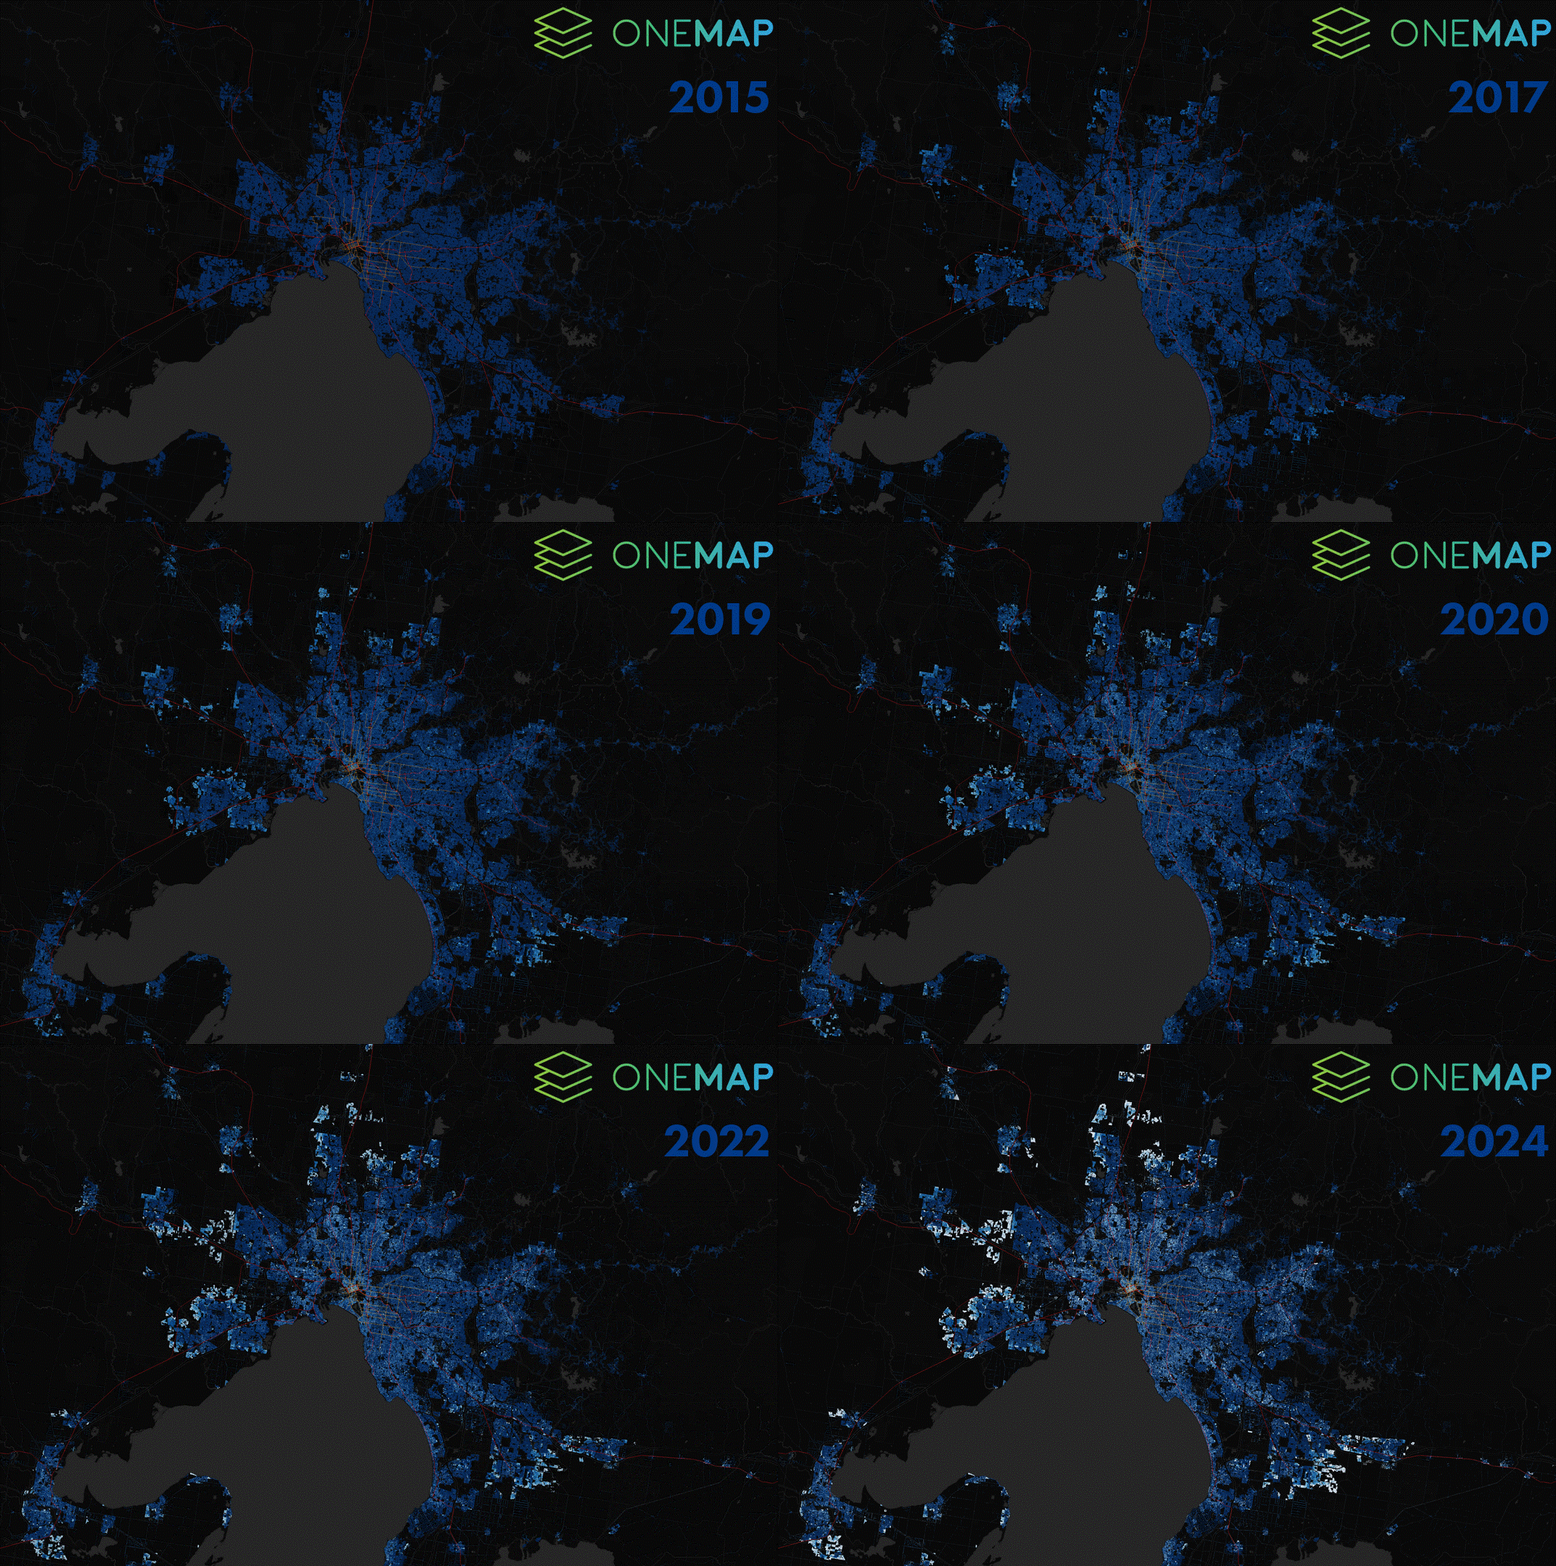
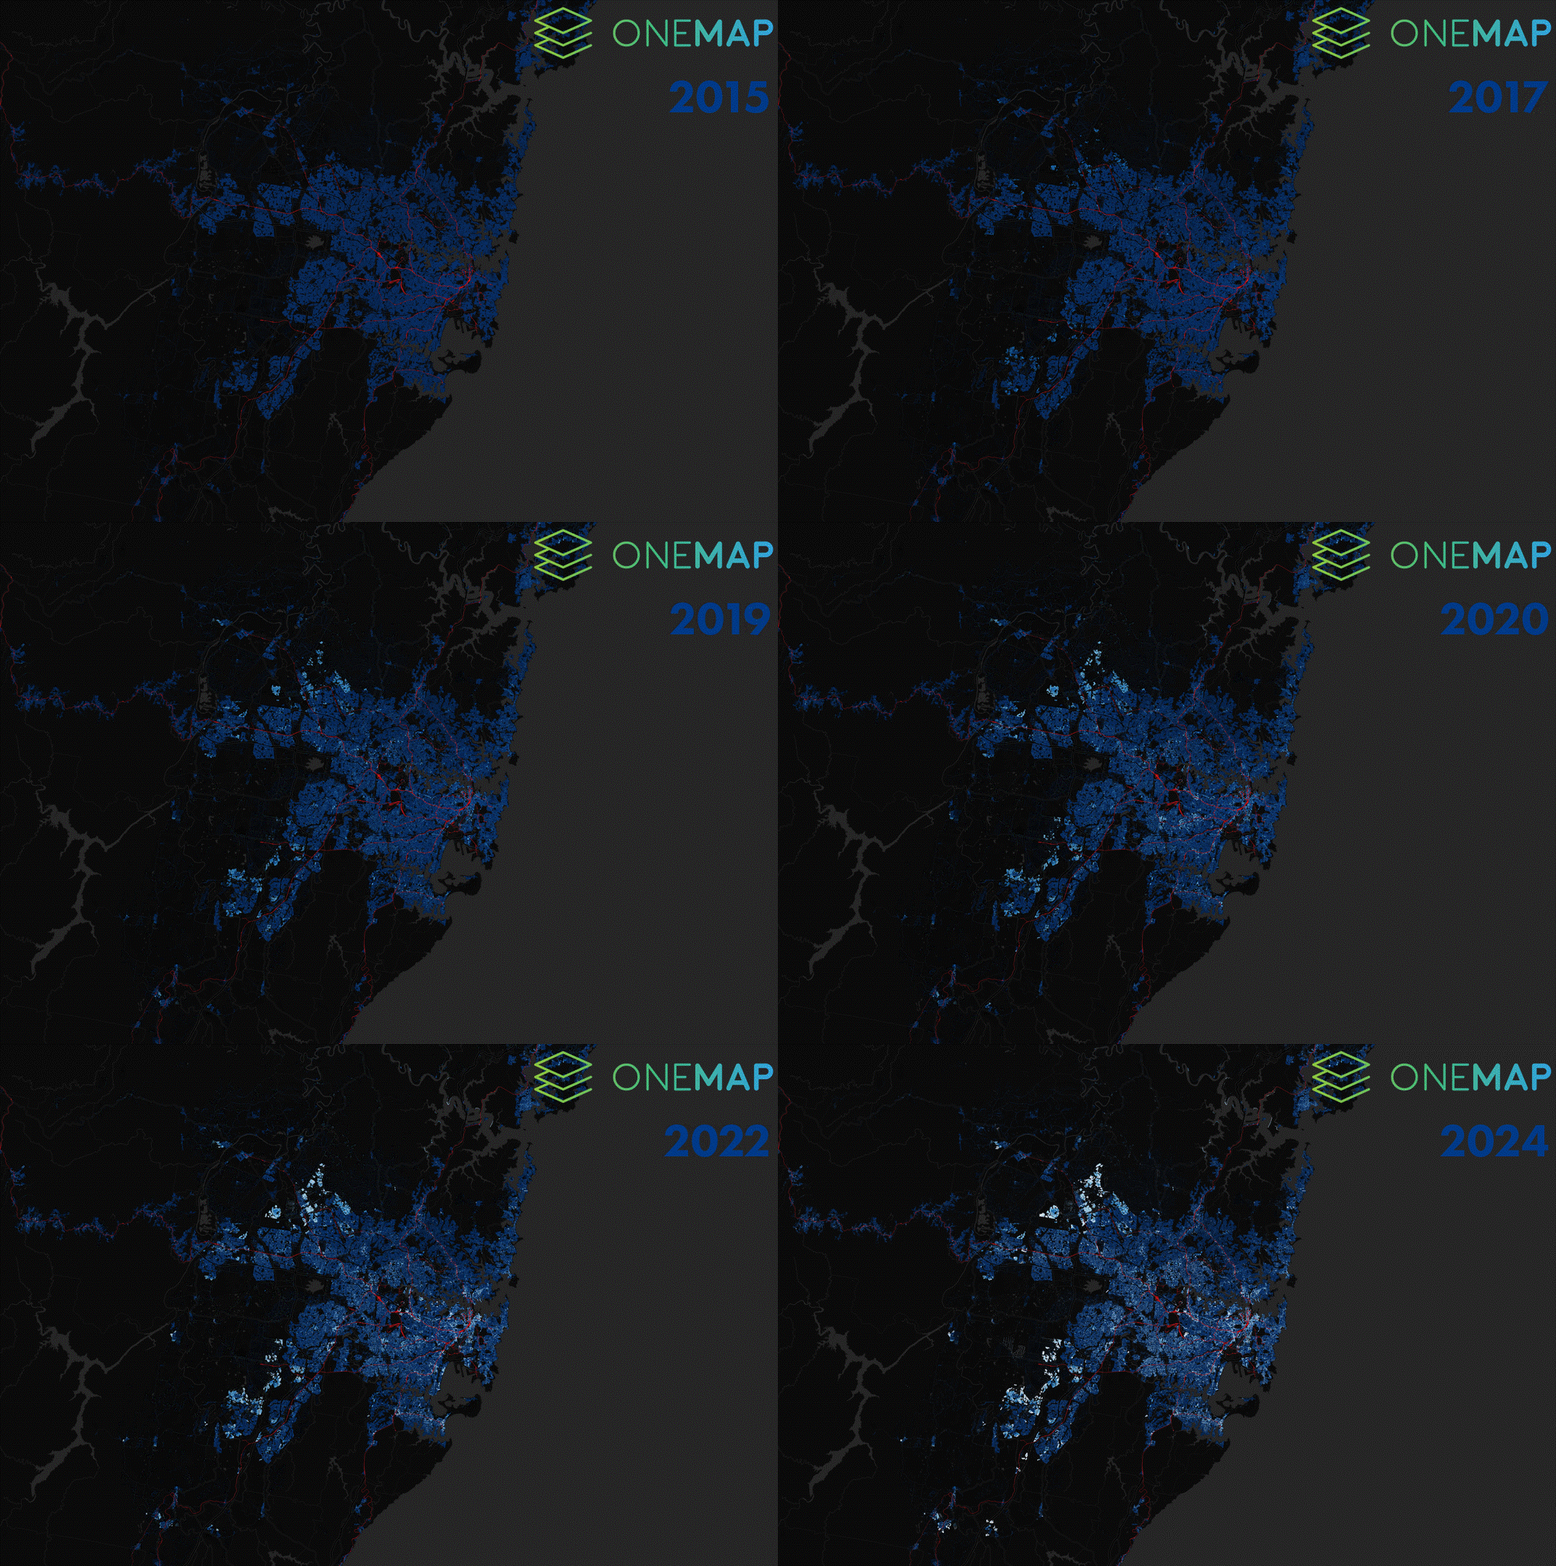
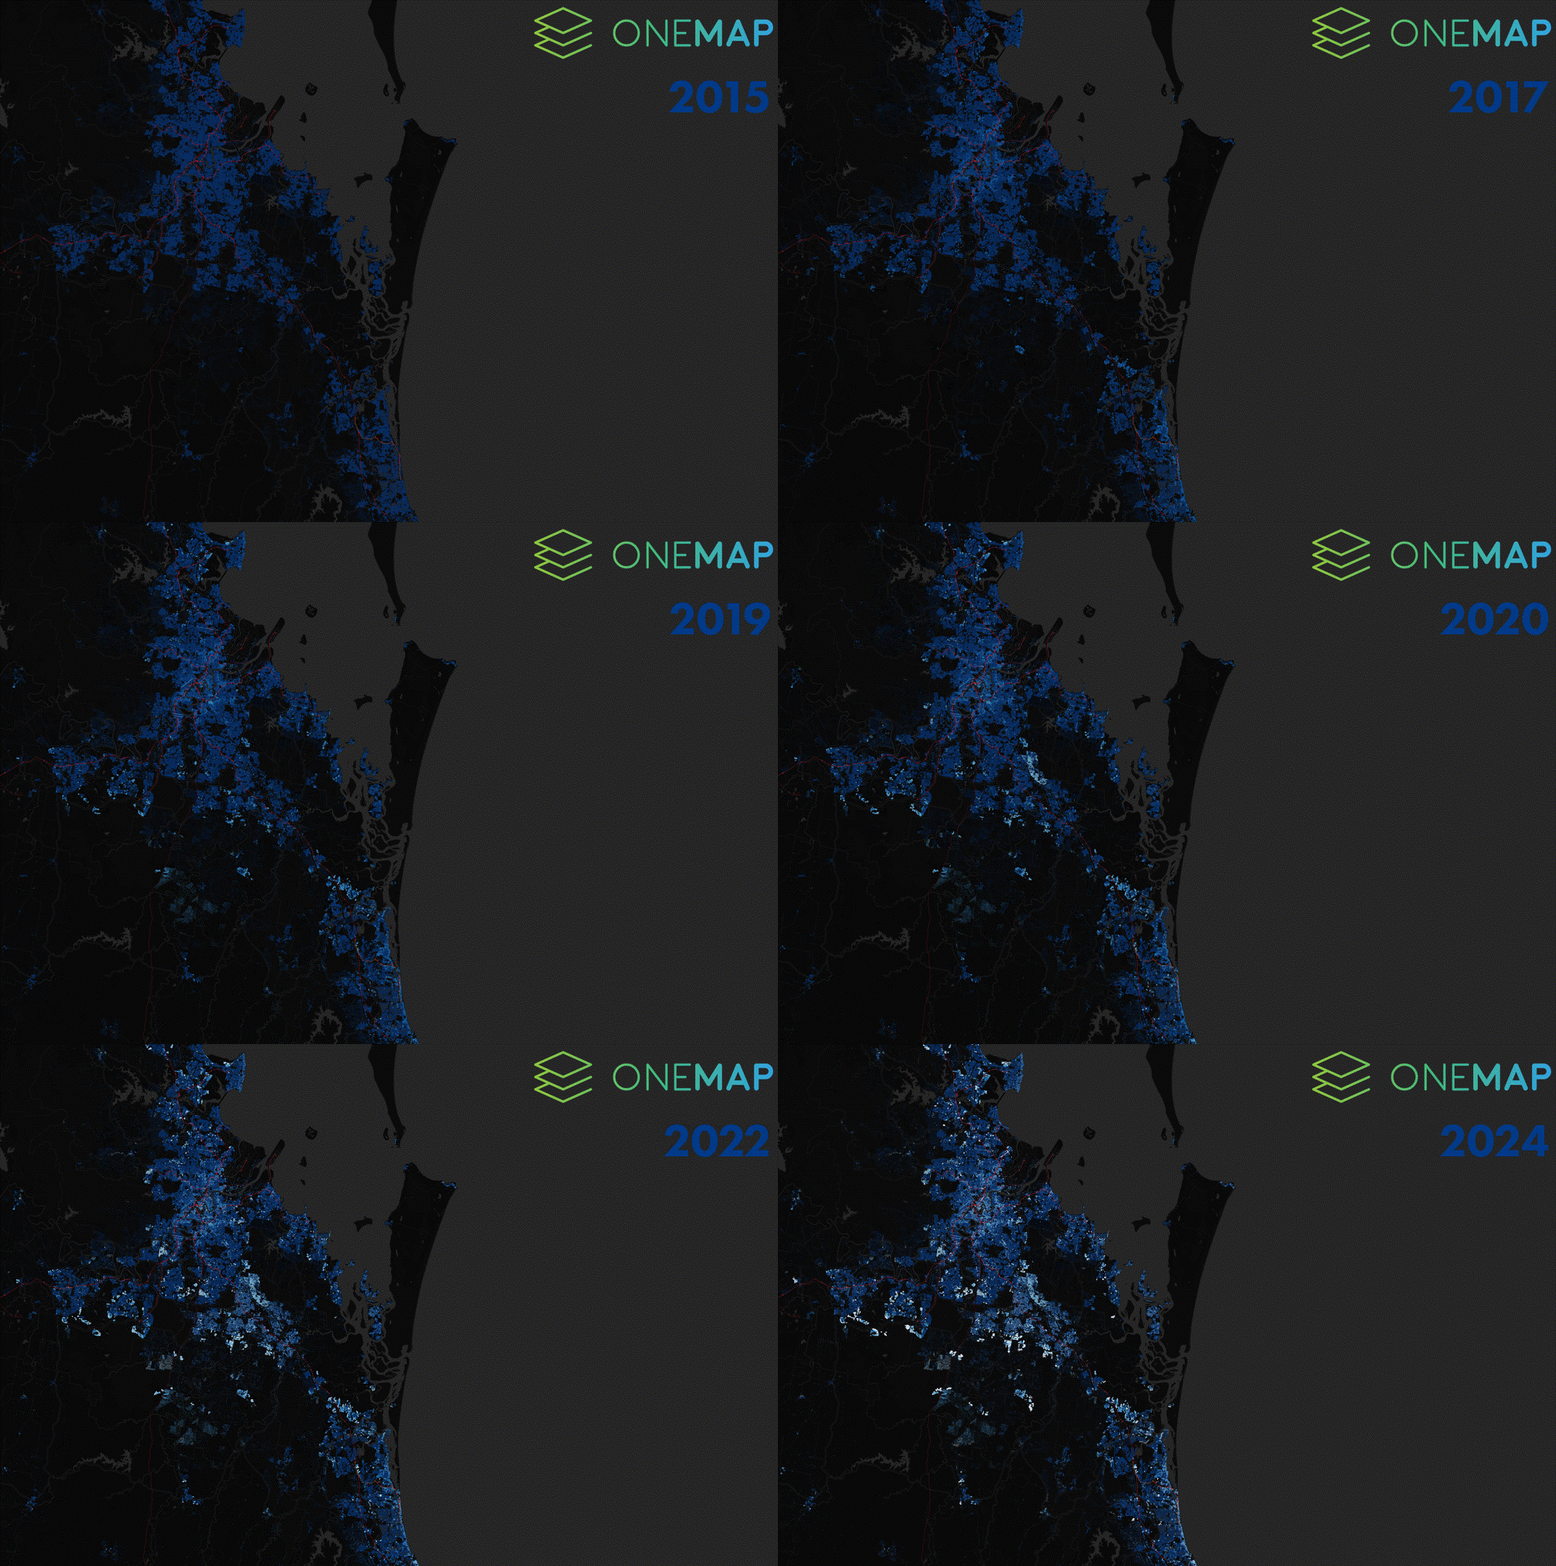
Working with Tract Consultants we set out to map the growth of the urban fringe from 2014 until today. Using the gazettal date of address points we were able to understand how our cities have grown in the last 10 years.
The images were created in preparation for a Macqaurie/Cloudstaff Bank hosted panel series which was run across a three different states in March 2025.
Greater Melbourne Growth 2014 – 2024:

Greater Sydney Growth 2014 – 2024:

South East Queensland Growth 2014 – 2024:

Nationwide Planning Changes
The last 12 months have seen a series of changes to the planning system around the country.
There have been changes in many jurisdictions focused on increasing supply and the allowable density of housing in our cities. Tract Consultants recently summarised these sweeping changes in this comprehensive and well informed announcement.
Tract Consultants – Nationwide Housing Reforms
These housing reforms means that out planning controls will change, something we have recently seen with the introduction of the new new Housing Choice and Transport Zone (HCTZ) and Built Form Overlay (BFO) in Victoria.
Read more about these Activity centre plans here.
As always, OneMap has been updated to include these new controls.
OneMap users can see were the HCTZ and BFOs are located and search for site in these new zones or overlays.
Victorian Housing Choice and Transport Zone (HCTZ) and Built Form Overlay (BFO):


OneMap – Filtering for sites within in the HCTZ:

